|
OoOJoin
0.0.1
The next generation of out-of-order join operator
|


|
|
OoOJoin
0.0.1
The next generation of out-of-order join operator
|
|
#include <string>#include <sys/time.h>#include <assert.h>#include <fcntl.h>#include <inttypes.h>#include <math.h>#include <stdint.h>#include <stdio.h>#include <stdlib.h>#include <string.h>#include <sys/syscall.h>#include <sys/types.h>#include <sys/ioctl.h>#include <sys/stat.h>#include <time.h>#include <unistd.h>#include <linux/perf_event.h>#include <signal.h>#include <memory.h>#include <memory>#include <vector>#include <Utils/ConfigMap.hpp>
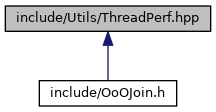
Go to the source code of this file.
Classes | |
| class | INTELLI::ThreadPerf |
| The top entity to provide perf traces, please use this class only UNLESS you know what you are doing. More... | |
| class | INTELLI::ThreadPerf::PerfPair |
| a record pair of perf events More... | |
| class | INTELLI::ThreadPerf::PerfTool |
Macros | |
| #define | PERF_ERROR(n) printf(n) |
| #define | LIBPERF_ARRAY_SIZE(x) (sizeof(x)/sizeof(x[0])) |
Enumerations | |
| enum | INTELLI::perfTrace { COUNT_SW_CPU_CLOCK = 0 , COUNT_SW_TASK_CLOCK = 1 , COUNT_SW_CONTEXT_SWITCHES = 2 , COUNT_SW_CPU_MIGRATIONS = 3 , COUNT_SW_PAGE_FAULTS = 4 , COUNT_SW_PAGE_FAULTS_MIN = 5 , COUNT_SW_PAGE_FAULTS_MAJ = 6 , COUNT_HW_CPU_CYCLES = 7 , COUNT_HW_INSTRUCTIONS = 8 , COUNT_HW_CACHE_REFERENCES = 9 , COUNT_HW_CACHE_MISSES = 10 , COUNT_HW_BRANCH_INSTRUCTIONS = 11 , COUNT_HW_BRANCH_MISSES = 12 , COUNT_HW_BUS_CYCLES = 13 , COUNT_HW_CACHE_L1D_LOADS = 14 , COUNT_HW_CACHE_L1D_LOADS_MISSES = 15 , COUNT_HW_CACHE_L1D_STORES = 16 , COUNT_HW_CACHE_L1D_STORES_MISSES = 17 , COUNT_HW_CACHE_L1D_PREFETCHES = 18 , COUNT_HW_CACHE_L1I_LOADS = 19 , COUNT_HW_CACHE_L1I_LOADS_MISSES = 20 , COUNT_HW_CACHE_LL_LOADS = 21 , COUNT_HW_CACHE_LL_LOADS_MISSES = 22 , COUNT_HW_CACHE_LL_STORES = 23 , COUNT_HW_CACHE_LL_STORES_MISSES = 24 , COUNT_HW_CACHE_DTLB_LOADS = 25 , COUNT_HW_CACHE_DTLB_LOADS_MISSES = 26 , COUNT_HW_CACHE_DTLB_STORES = 27 , COUNT_HW_CACHE_DTLB_STORES_MISSES = 28 , COUNT_HW_CACHE_ITLB_LOADS = 29 , COUNT_HW_CACHE_ITLB_LOADS_MISSES = 30 , COUNT_HW_CACHE_BPU_LOADS = 31 , COUNT_HW_CACHE_BPU_LOADS_MISSES = 32 } |
| The low level description of perf events, used inside, don't touch me UNLESS you know what you are doing. | |
 1.9.1
1.9.1